web ブラウザを介さずに、D3 を使ってグラフを作る方法を考えます。コマンドラインから javascript を実行して、csv ファイルを読み込み、棒グラフを作って svg ファイルに保存します。
おもに参考にしたのはこちらの記事です。「D3.js + jsdomでSVGファイルを作成 & pngに変換」。
外部ライブラリの用意をする
プロジェクト用のフォルダを作り、node.js のパッケージ管理システムである npm を利用して、必要な外部ライブラリを用意します。 D3 のほかに、node.js上でHTML文書を操作するための jsdom 、csv を読み込み、json に変換するcsvtojson のライブラリを利用します。csvtojson は前回使った d3.csv が今回のやり方ではエラーになって使えなくなったため、代わりにつかいます。
D3 がバージョン4から5になったときに、データ読み込み関数が、「データをコールバック関数で受け取る」から、「Promiseを返す」ように変更になり、内部的には d3-request モジュールを廃止して d3-fetch モジュールに変更になったことの影響と思われます。promise や fetch の取り扱いが分かればエラーを回避できるのかもしれませんが素人には荷が重いのでおとなしく諦めます。参考「D3.js ver.5について。」
新しいフォルダをつくり、コマンドプロンプト(Win)またはターミナル(Mac)でそのフォルダに移動します。npm init で初期化したのち、 npm install でライブラリをフォルダ内にインストールします。フォルダ内に data フォルダをつくって、csv を保存します。svg ファイルを保存するために svg フォルダも作っておきます。
cd /(作業フォルダのパス)

npm init

npm install d3
npm install jsdom
npm install csvtojson
スクリプトファイル
適当な名前で javascript ファイルを作ります。グラフの描画部分はほぼそのまま前回のを流用できるので、おもにデータを読み込み、ファイルを保存する部分を追加します。
ライブラリの読み込み
さきほどインストールした外部ライブラリのほか、 ファイルとパスの操作のため、 node の組み込みモジュールから、fs と path を読み込みます。
const d3 = require('d3');
const { JSDOM } = require('jsdom');
const csv=require('csvtojson');

const fs = require('fs');
const path = require('path');
ディレクトリとファイル名の設定
path モジュールを使って、データディレクトリとファイル名の設定をします。
//カレントディレクトリを取得
const dir = process.cwd();
//データディレクトリ
const datadir = path.join(dir, "data");
//データファイル名
const fullPath = path.join(datadir, "tokyo.csv");
//保存先ファイル名
const targetPath = path.format({
                dir: path.join(dir, "svg"),
                name: path.basename(fullPath, path.extname(fullPath)),
                ext: ".svg"
            });

//読み込み元ファイル名と出力先ファイル名を表示させます
console.log(fullPath + "から" + targetPath+ "を作成します");
描画サイズとマージン設定
データファイルを読みこむまえにサイズとマージンを設定しておきます。
//マージン設定
const margin = { left:40, right:0, top:25, bottom:40 };

//SVGのサイズ設定
const svgWidth = 262;
const svgHeight = 184;

//グラフのサイズ設定
const chartWidth = svgWidth - margin.left - margin.right;
const chartHeight = svgHeight - margin.top - margin.bottom;
ドキュメントとSVG要素
jsdom でドキュメントを作ります。前回までのブラウザのウィンドウに代わる操作対象になります。これまでと同様にsvg要素を作り、タイトル、ラベル、背景などを書いて、グラフ描画用のグループを追加します。
//新規ドキュメント
const document = new JSDOM().window.document;
//SVG要素を追加
const svg = d3.select(document.body)
              .append('svg')
              .attr("xmlns",'http://www.w3.org/2000/svg')
              .attr('width', svgWidth)
              .attr('height', svgHeight);

//タイトルを追加
svg.append("text")
    .attr("x", 0)
    .attr("y", 10)
    .attr("font-size", "10px")
    .attr("text-anchor", "top")
    .attr("font-family", "Tazugane Info Std N")
    .attr("font-weight", 700)
    .text("年齢5歳階級別人口[東京都]");

svg.append("line")
    .attr("x1", 0)
    .attr("x2", svgWidth)
    .attr("y1", 15)
    .attr("y2", 15)
    .attr("stroke", "#000000")
    .attr("stroke-width", "0.1mm");


//グループ要素の追加
const g = svg.append("g")
        .attr("transform", "translate(" + margin.left + ", " + margin.top + ")");

//背景グレーを追加
g.append("rect")
 .attr("class", "background")
 .attr("x", 0)
 .attr("y", 0)
 .attr("width", chartWidth)
 .attr("height", chartHeight)
 .attr("fill", "#e5e5e5");


//軸ラベルを追加
// X 軸
g.append("text")
    .attr("y", chartHeight + 40)
    .attr("x", chartWidth / 2)
    .attr("font-size", "10px")
    .attr("text-anchor", "middle")
    .attr("font-family", "Tazugane Info Std N")
    .attr("font-weight", 300)
    .text("年齢");

// Y 軸
g.append("text")
    .attr("y", chartHeight/2)
    .attr("x", -30)
    .attr("font-size", "10px")
    .attr("text-anchor", "middle")
    .attr("font-family", "Tazugane Info Std N")
    .attr("font-weight", 300)
    .attr("writing-mode", "tb")
    .text("人口【千人】");
CSVファイルを読み込む
csv ファイルを読み込みます。人口の数値の列の値を数値に変換します。
csv()
    .fromFile(fullPath)
    .then((data)=>{

        //人口【千人】列の値を数値に変換する
        data.forEach(function(d) {
            d["人口【千人】"] = +d["人口【千人】"];
        });

        console.log(data)

        //読み込んだデータをもとにグラフを描画する

        //描画したグラフをファイルに保存する


    });
グラフ描画部分は前回と一緒なので飛ばして、最後にファイルを保存します。
//描画したグラフをファイルに保存する
 fs.writeFile(targetPath, document.body.innerHTML, (err) => {
        if(err){
            console.log("エラーが発生しました。" + err);
            throw err
        } else {
            console.log(targetPath + "を保存しました");
        }

    });
スクリプトの全体は以下のようになりました。
const d3 = require('d3');
const { JSDOM } = require('jsdom');
const csv=require('csvtojson');

const fs = require('fs');
const path = require('path');

//ファイルパスの設定
//カレントディレクトリを取得
const dir = process.cwd();
//データディレクトリ
const datadir = path.join(dir, "data");
//データファイル名
const fullPath = path.join(datadir, "tokyo.csv");
//保存先ファイル名
const targetPath = path.format({
                dir: path.join(dir, "svg"),
                name: path.basename(fullPath, path.extname(fullPath)),
                ext: ".svg"
            });


console.log(fullPath + "から" + targetPath+ "を作成します");


//マージン設定
const margin = { left:40, right:0, top:25, bottom:40 };

//SVGのサイズ設定
const svgWidth = 262;
const svgHeight = 184;

//グラフのサイズ設定
const chartWidth = svgWidth - margin.left - margin.right;
const chartHeight = svgHeight - margin.top - margin.bottom;

//新規ドキュメント
const document = new JSDOM().window.document;
//SVG要素を追加
const svg = d3.select(document.body)
              .append('svg')
              .attr("xmlns",'http://www.w3.org/2000/svg')
              .attr('width', svgWidth)
              .attr('height', svgHeight);

//タイトルを追加
svg.append("text")
    .attr("x", 0)
    .attr("y", 10)
    .attr("font-size", "10px")
    .attr("text-anchor", "top")
    .attr("font-family", "Tazugane Info Std N")
    .attr("font-weight", 700)
    .text("年齢5歳階級別人口[東京都]");

svg.append("line")
    .attr("x1", 0)
    .attr("x2", svgWidth)
    .attr("y1", 15)
    .attr("y2", 15)
    .attr("stroke", "#000000")
    .attr("stroke-width", "0.1mm");


//グループ要素の追加
const g = svg.append("g")
        .attr("transform", "translate(" + margin.left + ", " + margin.top + ")");

//背景グレーを追加
g.append("rect")
 .attr("class", "background")
 .attr("x", 0)
 .attr("y", 0)
 .attr("width", chartWidth)
 .attr("height", chartHeight)
 .attr("fill", "#e5e5e5");


//軸ラベルを追加
// X 軸
g.append("text")
    .attr("y", chartHeight + 38)
    .attr("x", chartWidth / 2)
    .attr("font-size", "10px")
    .attr("text-anchor", "middle")
    .attr("font-family", "Tazugane Info Std N")
    .attr("font-weight", 300)
    .text("年齢");

// Y 軸
g.append("text")
    .attr("y", chartHeight/2)
    .attr("x", -30)
    .attr("font-size", "10px")
    .attr("text-anchor", "middle")
    .attr("font-family", "Tazugane Info Std N")
    .attr("font-weight", 300)
    .attr("writing-mode", "tb")
    .text("人口【千人】");

//csv読み込み
csv()
    .fromFile(fullPath)
    .then((data)=>{

        //人口【千人】列の値を数値に変換する
        data.forEach(function(d) {
            d["人口【千人】"] = +d["人口【千人】"];
        });

        console.log(data)

        //読み込んだデータをもとにグラフを描画する
        // Xスケール
        const xScale = d3.scaleBand()
            .domain(data.map(function(d){ return d["年齢5歳階級"] }))
            .range([0, chartWidth])
            .padding(0.2);

        // Yスケール
        const yScale = d3.scaleLinear()
            .domain([0, 1200])
            .range([chartHeight, 0]);

        // 横軸
        const xAxisCall = d3.axisBottom(xScale)
                            .tickSize(0);
        const xAxis = g.append("g")
            .attr("class", "x axis")
            .attr("transform", "translate(0," + chartHeight +")")
            .call(xAxisCall);

        xAxis.selectAll("path")
                .attr("stroke", "none");
        xAxis.selectAll("text")
            .attr("x", "0")
            .attr("y", "1")
            .attr("text-anchor", "end")
            .attr("font-family", "Tazugane Info Std N")
            .attr("font-weight", 300)
            .attr("font-size", "7px")
            .attr("x", "-1")
            .attr("y", "1")
            .attr("transform", "rotate(-45)");

        // 縦軸
        const yAxisCall = d3.axisLeft(yScale)
                            .tickSize(-chartWidth);
        const yAxis = g.append("g")
            .attr("class", "y axis")
            .call(yAxisCall);

        yAxis.selectAll("line")
                .attr("stroke", "#ffffff")
                .attr("stroke-width", "0.1mm");
        yAxis.selectAll("path")
                .attr("stroke", "none");
        yAxis.selectAll("text")
            .attr("x", "-3")
            .attr("y", "0")
            .attr("text-anchor", "end")
            .attr("font-family", "Tazugane Info Std N")
            .attr("font-weight", 300)
            .attr("font-size", "7px");

        // 棒を描く
        const rects = g.selectAll("rect.bar")
            .data(data);

        rects.enter()
            .append("rect")
                .attr("class", "bar")
                .attr("y", function(d){ return yScale(d["人口【千人】"]); })
                .attr("x", function(d){ return xScale(d["年齢5歳階級"]); })
                .attr("height", function(d){ return chartHeight - yScale(d["人口【千人】"]); })
                .attr("width", xScale.bandwidth)
                .attr("fill", "#666666");

        //値のラベルをつける
        const valueLabel = g.selectAll("text.value")
            .data(data);

        valueLabel.enter()
            .append("text")
            .attr("class", "value")
            .attr("fill", "#ffffff")
            .attr("transform", "rotate(90)")
            .attr("y", function(d){ return -xScale(d["年齢5歳階級"])-2; })
            .attr("x", function(d){ return yScale(d["人口【千人】"])+2; })
            .attr("text-anchor", "top")
            .attr("font-family", "Tazugane Info Std N")
            .attr("font-weight", 500)
            .attr("font-size", "7px")
            .text(function(d){ return d["人口【千人】"]; });

        //グラフの上下をケイ線で区切る
        g.append("line")
            .attr("x1", 0)
            .attr("x2", chartWidth)
            .attr("y1", 0)
            .attr("y2", 0)
            .attr("stroke", "#000000")
            .attr("stroke-width", "0.3mm");
        g.append("line")
            .attr("x1", 0)
            .attr("x2", chartWidth)
            .attr("y1", chartHeight)
            .attr("y2", chartHeight)
            .attr("stroke", "#000000")
            .attr("stroke-width", "0.3mm");

        //描画したグラフをファイルに保存する
        fs.writeFile(targetPath, document.body.innerHTML, (err) => {
                if(err){
                    console.log("エラーが発生しました。" + err);
                    throw err
                } else {
                    console.log(targetPath + "を保存しました");
                }

        });

    });
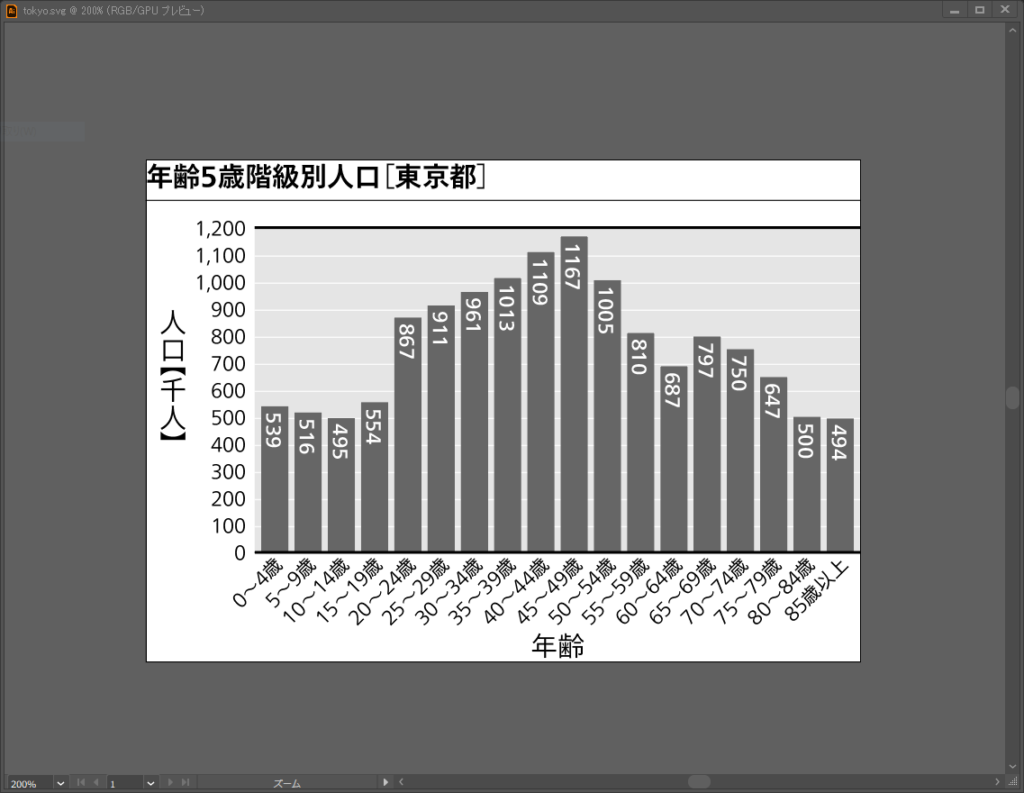
スクリプトの実行
完成したスクリプトをコマンドラインから実行(node javascriptファイル名)すると、svgフォルダに tokyo.svg ファイルができます。SVG を illustrator で開くと、SVGのサイズがアートボードのサイズになっています。全選択・グレースケール変換・書類のカラーモード変更で、モノクロのグラフが得られます。
node barchartsvg.js