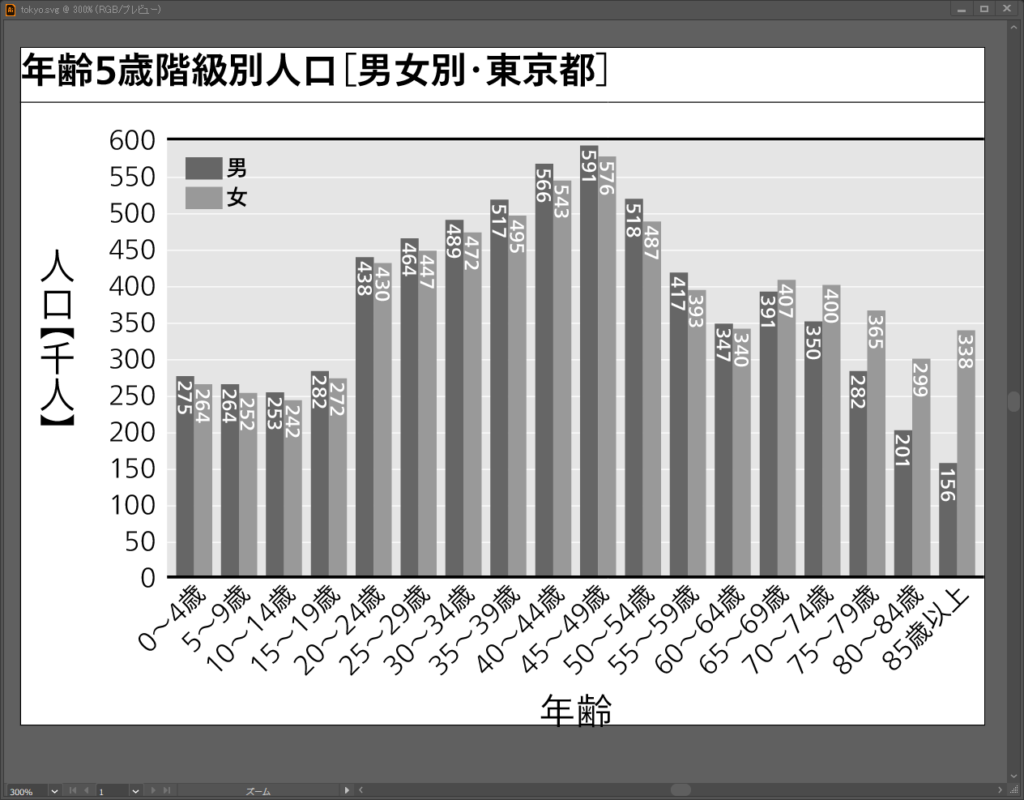
以前棒グラフを SVG で保存したやり方で、2系列の棒グラフをつくってみます。東京都の年齢区分別の人口を男女別で2系列の棒グラフにします。使用するデータは下のようなものです。
| 年齢5歳階級 | 男 | 女 |
| 0~4歳 | 275 | 264 |
| 5~9歳 | 264 | 252 |
| 10~14歳 | 253 | 242 |
| 15~19歳 | 282 | 272 |
| 20~24歳 | 438 | 430 |
| 25~29歳 | 464 | 447 |
| 30~34歳 | 489 | 472 |
| 35~39歳 | 517 | 495 |
| 40~44歳 | 566 | 543 |
| 45~49歳 | 591 | 576 |
| 50~54歳 | 518 | 487 |
| 55~59歳 | 417 | 393 |
| 60~64歳 | 347 | 340 |
| 65~69歳 | 391 | 407 |
| 70~74歳 | 350 | 400 |
| 75~79歳 | 282 | 365 |
| 80~84歳 | 201 | 299 |
| 85歳以上 | 156 | 338 |
javascript のコードもほぼそのままで、各年齢区分ごとに2本ずつ棒を描画するため、幅を半分にしたりx座標値を調節し、凡例を加えています。このやりかただと、ただ2回同じことを繰り返しているだけなので、系列が増減するとその都度やりなおしになります。ほんとうはもっといいやり方があるかもしれません。
プロジェクトフォルダの直下に、javascriptファイル、data フォルダ、svg フォルダを配置し、data フォルダから csv ファイルを読み込み、svg フォルダにファイルを保存するものとしています。npm で d3、jsdom、csvtojson のライブラリを導入しておきます。
//ライブラリの読み込み
const d3 = require('d3');
const { JSDOM } = require('jsdom');
const csv=require('csvtojson');

const fs = require('fs');
const path = require('path');


//カレントディレクトリを取得
const dir = process.cwd();
//データディレクトリ
const datadir = path.join(dir, "data");
//データファイル名
const fullPath = path.join(datadir, "tokyo.csv");
//保存先ファイル名
const targetPath = path.format({
                dir: path.join(dir, "svg"),
                name: path.basename(fullPath, path.extname(fullPath)),
                ext: ".svg"
            });

//読み込み元ファイル名と出力先ファイル名を表示させます
console.log(fullPath + "から" + targetPath+ "を作成します");

//マージン設定
const margin = { left:40, right:0, top:25, bottom:40 };

//SVGのサイズ設定
const svgWidth = 262;
const svgHeight = 184;

//グラフのサイズ設定
const chartWidth = svgWidth - margin.left - margin.right;
const chartHeight = svgHeight - margin.top - margin.bottom;


//新規ドキュメント
const document = new JSDOM().window.document;
//SVG要素を追加
const svg = d3.select(document.body)
              .append('svg')
              .attr("xmlns",'http://www.w3.org/2000/svg')
              .attr('width', svgWidth)
              .attr('height', svgHeight);

//タイトルを追加
svg.append("text")
    .attr("x", 0)
    .attr("y", 10)
    .attr("font-size", "10px")
    .attr("text-anchor", "top")
    .attr("font-family", "Tazugane Info Std N")
    .attr("font-weight", 700)
    .text("年齢5歳階級別人口[男女別・東京都]");

svg.append("line")
    .attr("x1", 0)
    .attr("x2", svgWidth)
    .attr("y1", 15)
    .attr("y2", 15)
    .attr("stroke", "#000000")
    .attr("stroke-width", "0.1mm");


//グループ要素の追加
const g = svg.append("g")
        .attr("transform", "translate(" + margin.left + ", " + margin.top + ")");

//背景グレーを追加
g.append("rect")
 .attr("class", "background")
 .attr("x", 0)
 .attr("y", 0)
 .attr("width", chartWidth)
 .attr("height", chartHeight)
 .attr("fill", "#e5e5e5");


//軸ラベルを追加
// X 軸
g.append("text")
    .attr("y", chartHeight + 40)
    .attr("x", chartWidth / 2)
    .attr("font-size", "10px")
    .attr("text-anchor", "middle")
    .attr("font-family", "Tazugane Info Std N")
    .attr("font-weight", 300)
    .text("年齢");

// Y 軸
g.append("text")
    .attr("y", chartHeight/2)
    .attr("x", -30)
    .attr("font-size", "10px")
    .attr("text-anchor", "middle")
    .attr("font-family", "Tazugane Info Std N")
    .attr("font-weight", 300)
    .attr("writing-mode", "tb")
    .text("人口【千人】");


csv()
    .fromFile(fullPath)
    .then((data)=>{

        //男女の列の値を数値に変換する
        data.forEach(function(d) {
            d["男"] = +d["男"];
            d["女"] = +d["女"];
        });

        console.log(data)

        //読み込んだデータをもとにグラフを描画する
        // Xスケール
        const xScale = d3.scaleBand()
            .domain(data.map(function(d){ return d["年齢5歳階級"] }))
            .range([0, chartWidth])
            .padding(0.2);

        // Yスケール
        const yScale = d3.scaleLinear()
            .domain([0, 600])
            .range([chartHeight, 0]);

        // 横軸
        const xAxisCall = d3.axisBottom(xScale)
                            .tickSize(0);
        const xAxis = g.append("g")
            .attr("class", "x axis")
            .attr("transform", "translate(0," + chartHeight +")")
            .call(xAxisCall);

        xAxis.selectAll("path")
                .attr("stroke", "none");
        xAxis.selectAll("text")
            .attr("x", "0")
            .attr("y", "1")
            .attr("text-anchor", "end")
            .attr("font-family", "Tazugane Info Std N")
            .attr("font-weight", 300)
            .attr("font-size", "7px")
            .attr("x", "-1")
            .attr("y", "1")
            .attr("transform", "rotate(-45)");

        // 縦軸
        const yAxisCall = d3.axisLeft(yScale)
                            .tickSize(-chartWidth);
        const yAxis = g.append("g")
            .attr("class", "y axis")
            .call(yAxisCall);

        yAxis.selectAll("line")
                .attr("stroke", "#ffffff")
                .attr("stroke-width", "0.1mm");
        yAxis.selectAll("path")
                .attr("stroke", "none");
        yAxis.selectAll("text")
            .attr("x", "-3")
            .attr("y", "0")
            .attr("text-anchor", "end")
            .attr("font-family", "Tazugane Info Std N")
            .attr("font-weight", 300)
            .attr("font-size", "7px");

        // 1系列めの棒を描く
        const male = g.selectAll("rect.male").data(data);

        male.enter()
            .append("rect")
                .attr("class", "male")
                .attr("y", function(d){ return yScale(d["男"]); })
                .attr("x", function(d){ return xScale(d["年齢5歳階級"]); })
                .attr("height", function(d){ return chartHeight - yScale(d["男"]); })
                .attr("width", xScale.bandwidth()/2)
                .attr("fill", "#666666");

        //値のラベルをつける
        const maleValueLabel = g.selectAll("text.maleValue")
            .data(data);

        maleValueLabel.enter()
            .append("text")
            .attr("class", "maleValue")
            .attr("fill", "#ffffff")
            .attr("transform", "rotate(90)")
            .attr("y", function(d){ return -xScale(d["年齢5歳階級"])-0.6; })
            .attr("x", function(d){ return yScale(d["男"])+1; })
            .attr("text-anchor", "top")
            .attr("font-family", "Tazugane Info Std N")
            .attr("font-weight", 500)
            .attr("font-size", "5px")
            .text(function(d){ return d["男"]; });

        // 2系列めの棒を描く
        const female = g.selectAll("rect.female").data(data);

        female.enter()
            .append("rect")
                .attr("class", "female")
                .attr("y", function(d){ return yScale(d["女"]); })
                .attr("x", function(d){ return xScale(d["年齢5歳階級"])+xScale.bandwidth()/2; })
                .attr("height", function(d){ return chartHeight - yScale(d["女"]); })
                .attr("width", xScale.bandwidth()/2)
                .attr("fill", "#999999");

        //値のラベルをつける
        const femaleValueLabel = g.selectAll("text.femaleValue")
            .data(data);

        femaleValueLabel.enter()
            .append("text")
            .attr("class", "femaleValue")
            .attr("fill", "#ffffff")
            .attr("transform", "rotate(90)")
            .attr("y", function(d){ return -xScale(d["年齢5歳階級"])-0.6-xScale.bandwidth()/2; })
            .attr("x", function(d){ return yScale(d["女"])+1; })
            .attr("text-anchor", "top")
            .attr("font-family", "Tazugane Info Std N")
            .attr("font-weight", 500)
            .attr("font-size", "5px")
            .text(function(d){ return d["女"]; });

        //凡例
       const legend = g.append("g")
                        .attr("class", "legend")
                        .attr("transform", "translate(5, 5)");

        const legendRow = legend.append("g");

        legendRow.append("rect")
                    .attr("x", 0)
                    .attr("y", 0)
                    .attr("width", 10)
                    .attr("height", 6)
                    .attr("fill", "#666666");
        legendRow.append("text")
                    .attr("x", 11)
                    .attr("y", 5)
                    .attr("fill", "#000000")
                    .attr("text-anchor", "top")
                    .attr("font-family", "Tazugane Info Std N")
                    .attr("font-weight", 500)
                    .attr("font-size", "6px")
                    .text("男");

        legendRow.append("rect")
                    .attr("x", 0)
                    .attr("y", 8)
                    .attr("width", 10)
                    .attr("height", 6)
                    .attr("fill", "#999999");
        legendRow.append("text")
                    .attr("x", 11)
                    .attr("y", 13)
                    .attr("fill", "#000000")
                    .attr("text-anchor", "top")
                    .attr("font-family", "Tazugane Info Std N")
                    .attr("font-weight", 500)
                    .attr("font-size", "6px")
                    .text("女");

        //グラフの上下をケイ線で区切る
        g.append("line")
            .attr("x1", 0)
            .attr("x2", chartWidth)
            .attr("y1", 0)
            .attr("y2", 0)
            .attr("stroke", "#000000")
            .attr("stroke-width", "0.3mm");
        g.append("line")
            .attr("x1", 0)
            .attr("x2", chartWidth)
            .attr("y1", chartHeight)
            .attr("y2", chartHeight)
            .attr("stroke", "#000000")
            .attr("stroke-width", "0.3mm");
        //描画したグラフをファイルに保存する
        fs.writeFile(targetPath, document.body.innerHTML, (err) => {
            if(err){
                console.log("エラーが発生しました。" + err);
                throw err
            } else {
                console.log(targetPath + "を保存しました");
            }
        });


    });
下のようなグラフが出来ます。