フォルダから複数のCSVファイルを順次読み込み、棒グラフにしてSVGを保存します。これまでのサンプルを拡張して47都道府県の年齢5歳階級別人口のグラフを作ります。
フォルダから内包するファイルの名前を取得し、ドキュメント生成からファイル保存までの処理をファイルの数分の繰り返し処理の中に入れます。また、グラフの描画をデータに合わせて微修正します。具体的には、1. ファイル名を使って都道府県別のグラフタイトルにします。2. 各バーに表示する数値が、人口の少ないところでは棒から文字がはみだしてしまうため、170(千人)以下では、棒の上に黒字で表示するように変更します。
繰り返しの処理
ファイル名を取得する
データフォルダの中にあるファイルの名前を取得します。
//データディレクトリ内のファイル名を取得する
const filenames = fs.readdirSync(datadir);
//Macの場合用.DS_Storeを対象外にする
const datafiles = filenames.filter(f => f != '.DS_Store');
//ファイル名を表示する
console.log(datafiles);
ドキュメント生成、データ読み込み、グラフの描画、ファイル保存の処理をファイルごとの繰り返しの中にいれます。データファイル名を固定値から変数に変更します。
//ファイルごとに繰り返す
datafiles.forEach((filename) => {
    //データファイル名
    const fullPath = path.join(datadir, filename);
    //保存先ファイル名
    const targetPath = path.format({
                dir: path.join(dir, "svg"),
                name: path.basename(fullPath, path.extname(fullPath)),
                ext: ".svg"
            });

    console.log(fullPath + "から" + targetPath+ "を作成します");

    //ドキュメントを作る
    //svg要素を追加
    //csv読み込み
    //グラフ描画
    //ファイル保存
});
グラフの微修正
グラフタイトルの変更
グラフのタイトルの都道府県名部分を、csv ファイル名に基づいて書き換えるようにします。そのために csv ファイル名も「東京都.csv」のように漢字の都道府県名にします。
//タイトルを追加
svg.append("text")
    .attr("x", 0)
    .attr("y", 10)
    .attr("font-size", "10px")
    .attr("text-anchor", "top")
    .attr("font-family", "Tazugane Info Std N")
    .attr("font-weight", 700)
    .text("年齢5歳階級別人口[" + path.basename(fullPath, path.extname(fullPath)) + "]");
各バーの数値表示の変更
バーに表示する数値の形式を、人口の数値によって変更します。値の属性(”fill”, “x”, “text-ancher”)の値を、固定値から条件分岐で人口の値が170以下のときとそれ以外で違う値を返す関数に変更します。
//値のラベルをつける
const valueLabel = g.selectAll("text.value")
.data(data);
valueLabel.enter()
.append("text")
.attr("class", "value")
.attr("fill", function(d){
if (d["人口【千人】"] < 170) {
return "#000000";
} else {
return "#ffffff";
}
})
.attr("transform", "rotate(90)")
.attr("y", function(d){ return -xScale(d["年齢5歳階級"])-2; })
.attr("x", function(d){
if (d["人口【千人】"] < 170) {
return yScale(d["人口【千人】"])-1;
} else {
return yScale(d["人口【千人】"])+2;
}
})
.attr("text-anchor", function(d){
if (d["人口【千人】"] < 170) {
return "end";
} else {
return "top";
}
})
.attr("font-family", "Tazugane Info Std N")
.attr("font-weight", 500)
.attr("font-size", "7px")
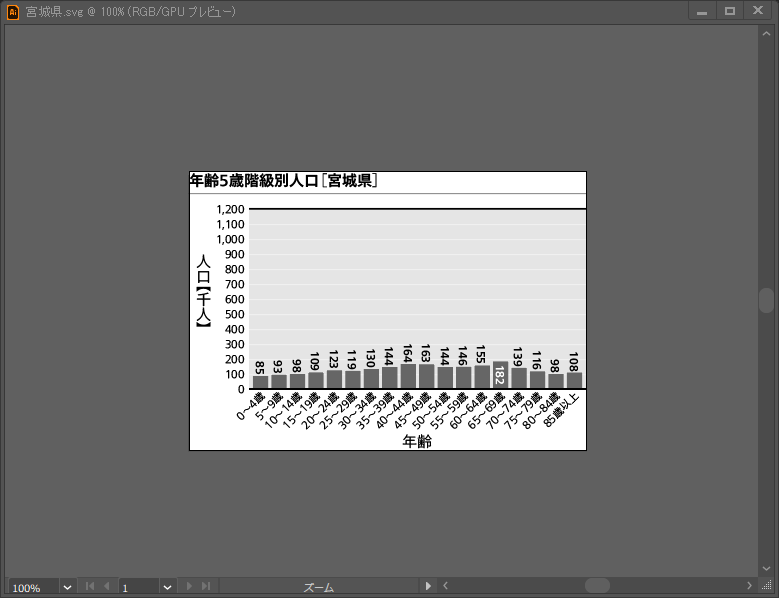
.text(function(d){ return d["人口【千人】"]; });たとえば、宮城県だとこんなグラフになります。全体に東京の人口が多すぎて、他の道府県は短い棒になりがちです。
スクリプトの全体は以下のようになります。
const d3 = require('d3');
const { JSDOM } = require('jsdom');
const csv=require('csvtojson');

const fs = require('fs');
const path = require('path');

//ファイルパスの設定
//カレントディレクトリを取得
const dir = process.cwd();
//データディレクトリ
const datadir = path.join(dir, "data");

//データディレクトリ内のファイル名を取得する
const filenames = fs.readdirSync(datadir);
//Macの場合用.DS_Storeを対象外にする
const datafiles = filenames.filter(f => f != '.DS_Store');

console.log(datafiles);

//マージン設定
const margin = { left:40, right:0, top:25, bottom:40 };

//SVGのサイズ設定
const svgWidth = 262;
const svgHeight = 184;

//グラフのサイズ設定
const chartWidth = svgWidth - margin.left - margin.right;
const chartHeight = svgHeight - margin.top - margin.bottom;

//ファイルごとに繰り返す
datafiles.forEach((filename) => {

    //新規ドキュメント
    const document = new JSDOM().window.document;

    //データファイル名
    const fullPath = path.join(datadir, filename);
    //保存先ファイル名
    const targetPath = path.format({
                dir: path.join(dir, "svg"),
                name: path.basename(fullPath, path.extname(fullPath)),
                ext: ".svg"
            });

    console.log(fullPath + "から" + targetPath+ "を作成します");


    //SVG要素を追加
    const svg = d3.select(document.body)
                  .append('svg')
                  .attr("xmlns",'http://www.w3.org/2000/svg')
                  .attr('width', svgWidth)
                  .attr('height', svgHeight);

    //タイトルを追加
    svg.append("text")
        .attr("x", 0)
        .attr("y", 10)
        .attr("font-size", "10px")
        .attr("text-anchor", "top")
        .attr("font-family", "Tazugane Info Std N")
        .attr("font-weight", 700)
        .text("年齢5歳階級別人口[" + path.basename(fullPath, path.extname(fullPath)) + "]");

    svg.append("line")
        .attr("x1", 0)
        .attr("x2", svgWidth)
        .attr("y1", 15)
        .attr("y2", 15)
        .attr("stroke", "#000000")
        .attr("stroke-width", "0.1mm");


    //グループ要素の追加
    const g = svg.append("g")
            .attr("transform", "translate(" + margin.left + ", " + margin.top + ")");

    //背景グレーを追加
    g.append("rect")
     .attr("class", "background")
     .attr("x", 0)
     .attr("y", 0)
     .attr("width", chartWidth)
     .attr("height", chartHeight)
     .attr("fill", "#e5e5e5");


    //軸ラベルを追加
    // X 軸
    g.append("text")
        .attr("y", chartHeight + 38)
        .attr("x", chartWidth / 2)
        .attr("font-size", "10px")
        .attr("text-anchor", "middle")
        .attr("font-family", "Tazugane Info Std N")
        .attr("font-weight", 300)
        .text("年齢");

    // Y 軸
    g.append("text")
        .attr("y", chartHeight/2)
        .attr("x", -30)
        .attr("font-size", "10px")
        .attr("text-anchor", "middle")
        .attr("font-family", "Tazugane Info Std N")
        .attr("font-weight", 300)
        .attr("writing-mode", "tb")
        .text("人口【千人】");

    //csv読み込み
    csv()
        .fromFile(fullPath)
        .then((data)=>{

            //人口【千人】列の値を数値に変換する
            data.forEach(function(d) {
                d["人口【千人】"] = +d["人口【千人】"];
            });

            console.log(data)

            //読み込んだデータをもとにグラフを描画する
            // Xスケール
            const xScale = d3.scaleBand()
                .domain(data.map(function(d){ return d["年齢5歳階級"] }))
                .range([0, chartWidth])
                .padding(0.2);

            // Yスケール
            const yScale = d3.scaleLinear()
                .domain([0, 1200])
                .range([chartHeight, 0]);

            // 横軸
            const xAxisCall = d3.axisBottom(xScale)
                                .tickSize(0);
            const xAxis = g.append("g")
                .attr("class", "x axis")
                .attr("transform", "translate(0," + chartHeight +")")
                .call(xAxisCall);

            xAxis.selectAll("path")
                    .attr("stroke", "none");
            xAxis.selectAll("text")
                .attr("x", "0")
                .attr("y", "1")
                .attr("text-anchor", "end")
                .attr("font-family", "Tazugane Info Std N")
                .attr("font-weight", 300)
                .attr("font-size", "7px")
                .attr("x", "-1")
                .attr("y", "1")
                .attr("transform", "rotate(-45)");

            // 縦軸
            const yAxisCall = d3.axisLeft(yScale)
                                .tickSize(-chartWidth);
            const yAxis = g.append("g")
                .attr("class", "y axis")
                .call(yAxisCall);

            yAxis.selectAll("line")
                    .attr("stroke", "#ffffff")
                    .attr("stroke-width", "0.1mm");
            yAxis.selectAll("path")
                    .attr("stroke", "none");
            yAxis.selectAll("text")
                .attr("x", "-3")
                .attr("y", "0")
                .attr("text-anchor", "end")
                .attr("font-family", "Tazugane Info Std N")
                .attr("font-weight", 300)
                .attr("font-size", "7px");

            // 棒を描く
            const rects = g.selectAll("rect.bar")
                .data(data);

            rects.enter()
                .append("rect")
                    .attr("class", "bar")
                    .attr("y", function(d){ return yScale(d["人口【千人】"]); })
                    .attr("x", function(d){ return xScale(d["年齢5歳階級"]); })
                    .attr("height", function(d){ return chartHeight - yScale(d["人口【千人】"]); })
                    .attr("width", xScale.bandwidth)
                    .attr("fill", "#666666");

            //値のラベルをつける
            const valueLabel = g.selectAll("text.value")
                .data(data);

            valueLabel.enter()
                .append("text")
                .attr("class", "value")
                .attr("fill", function(d){
                        if (d["人口【千人】"] < 170) {
                            return "#000000";
                        } else {
                            return "#ffffff";
                        }
                    })
                .attr("transform", "rotate(90)")
                .attr("y", function(d){ return -xScale(d["年齢5歳階級"])-2; })
                .attr("x", function(d){
                        if (d["人口【千人】"] < 170) {
                            return yScale(d["人口【千人】"])-1;
                        } else {
                            return yScale(d["人口【千人】"])+2;
                        }
                    })
                .attr("text-anchor", function(d){
                        if (d["人口【千人】"] < 170) {
                            return "end";
                        } else {
                            return "top";
                        }
                    })
                .attr("font-family", "Tazugane Info Std N")
                .attr("font-weight", 500)
                .attr("font-size", "7px")
                .text(function(d){ return d["人口【千人】"]; });

            //グラフの上下をケイ線で区切る
            g.append("line")
                .attr("x1", 0)
                .attr("x2", chartWidth)
                .attr("y1", 0)
                .attr("y2", 0)
                .attr("stroke", "#000000")
                .attr("stroke-width", "0.3mm");
            g.append("line")
                .attr("x1", 0)
                .attr("x2", chartWidth)
                .attr("y1", chartHeight)
                .attr("y2", chartHeight)
                .attr("stroke", "#000000")
                .attr("stroke-width", "0.3mm");

            //ファイル保存
            fs.writeFile(targetPath, document.body.innerHTML, (err) => {
                    if(err){
                        console.log("エラーが発生しました。" + err);
                        throw err
                    } else {
                        console.log(targetPath + "を保存しました");
                    }

            });

        });
});
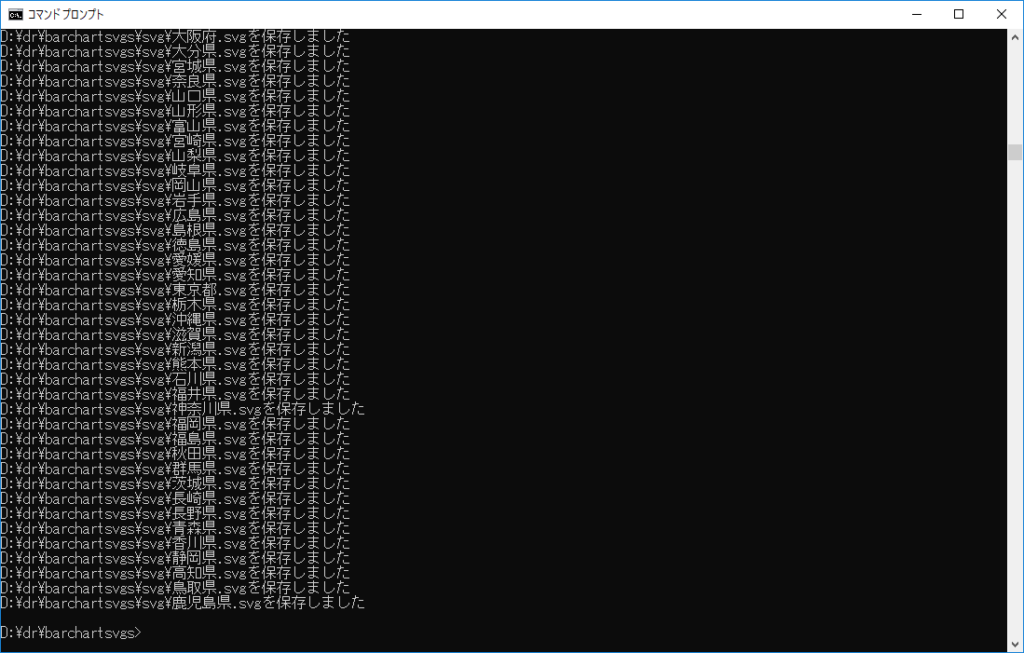
このスクリプトをコマンドラインから実行すると、データフォルダ内のすべてのcsvから棒グラフのSVGを保存します。
この次は、illustrator のアクションとバッチの機能を使って、今回作った多量のsvgファイルを一気にグレースケール化して、D3で棒グラフを作るシリーズの一旦の完結編とします。